


Economic or ecological systems, a city or region, even an urban quarter or an organization present us with difficult challenges. Often, each one of us only understands a small piece of reality and fails to fathom why other people see the world so differently. We are placed in a quandary like that of the blind men and the elephant, who can not agree what kind of an animal the elephant is.
In my workshops, groups of people work together to create graphics to visualize complex relationships. Thus they find leverage points to influence a system in helpful ways. In the process, they come to an understanding how different, apparently mutually exclusive viewpoints can complement each other. Working in common toward a shared goal becomes possible.
This method is especially useful for involving diverse people with a variety of perspectives in the formulation of strategies in areas such as
- urban, village or regional development,
- environmental or nature protection,
- responsible development of a business, or
- the solution of social problems.
Depending on the task at hand, the events can be public or restricted to invited participants. A one-time event can be useful in order to gain a common understanding of beneficial intervention opportunities. Alternatively, it is possible to continue working with the systems graphics in order to work out strategies in more detail or to assess performance. I will be glad to discuss which procedure may best fit your situation.
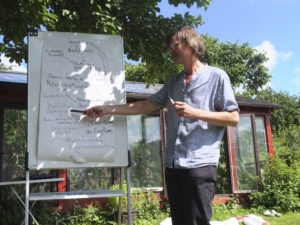
Workshop at the Commons Summerschool, Bechstedt, Thuringia, June 2018. Photo: Vera Hofmann
Links with further explanations
A workshop that I offered on 4/14/2018 at the Volkshochschule Heidelberg provided insights into how useful it can be to work together as a group to create systems graphics to visualize complex relationships. See the following report: Systems Graphic Workshop VHS Heidelberg April 2018
My article How to make a systems graphic to understand shared enterprises uses the example of Solidago (a solidarity-based mutual health insurance organization) to show how systems graphics can be created and used in order to identify possible action strategies. In a workshop within the Summer Academy 2017 of the Heinrich-Böll-Stiftung Nordrhein-Westfalen this method was used to sketch strategies to increase the share of organic food at school cafeterias in a German city.
Selected other workshops given in recent years
- September 2017. Participation at the Workshop “Kein Ausverkauf der Natur: Schutz und Nutzung (globaler) Gemeinschaftsgüter demokratisch gestalten,” (No selling out of nature: democratic design of the protection and use of (global) common goods), Forum Umwelt und Entwicklung, Berlin.
- November 2014. Workshop on „Commons“ at a state-level meeting of the Young Greens of North-Rhine-Westfalia in Gelsenkirchen, Germany.
- May 2013. Workshop on economics of abundance in an open space format at the
„Geld oder Leben“ (money or life) Symposium in Schrems, Austria. - November 2010. Abundant Mobility: One Town’s Resources. Shareable
- July 2010. Economics of Abundance Workshop. Shareable
- March 2009. Taking Responsibility to Build a Liberatory, Equitable, and Sustainable Economy. Workshop in cooperation with Nina Gregg, at the Forum on the Solidarity Economy, Amherst, Massachusetts.